Thailand Under the Alternative Vote
- thaidatapointscom
- Nov 18, 2014
- 7 min read
By Allen Hicken

Picture: Government House of Thailand
Source: Wikipedia Commons
In the debates about Thai constitutional reform the electoral system is receiving a good deal of attention, as we would expect. In the past few weeks I have heard all of the following proposed for Thailand:
- Status quo (mixed-member majoritarian (MMM) system, with 375:125 SMD:PR ratio)
- Status quo MMM but with 50:50 ratio
- A German-style mixed-member proportional system
- Open-list PR with provinces as the electoral constituency
- Closed-list PR with provinces as the electoral constituency
- STV with provinces as the electoral constituency
- Alternative vote
- Return of the Block Vote (the pre-1997 electoral system)
- SNTV
This is a lot to choose from and we don’t yet know where reformers will go. There seems, however, to be some serious consideration being given to adopting an alternative vote (AV) system. The Alternative Vote (AV) is used in single-seat districts. Also called instant-runoff voting, AV seeks to ensure that each candidate elected has the support of a majority of the voters. Voters begin by rank the candidates on the ballot. If any candidate captures an outright majority of the first place votes he or she wins. If no candidate wins a majority based on first preference votes, then the candidate with the fewest votes is eliminated and those votes are redistributed to the remaining candidates based on voters’ preference ordering. This process continues until a candidate obtains a majority of the votes.
What would be the effects of such a system on the party system and electoral outcomes? We can, perhaps, say something about what the move to AV might mean by looking at the 2011 constituency results and simulating what the results might have been had AV been used instead. Obviously the major challenge to such an effort is that we don’t have information about voters’ preference ordering. Still, we can simulate what outcome would have looked like under different sets of preference ordering assumptions and then compare those results with the actual election results.
To conduct these simulations I need to make a couple of simplifying assumptions. First, I assume that AV would use the same constituencies used to elect constituency MPs in 2011. That is, there would be 375 AV constituencies, with the same boundaries as 2011. This will almost certainly not be the case if AV is adopted but it is a necessary assumption to make if we want to analyze and compare possible outcomes. Second, I assume that we can take the number of votes candidates received in the 2011 election as a reasonable proxy for the number of first preference votes they would have received under AV. It is possible, however, that AV would affect the strategic calculations of at least some voters. For example under the 2011 plurality system a voter who sincerely preferred the Bhumjaithai Party may have concluded that that candidate did not have a chance to win, and so instead voted strategically for the Pheu Thai or Democrat candidate. It is possible that under AV that voter might list Bhumjaithai as their first preference, and then list the Pheu Thai or Democrat candidate as their second choice. To the extent that this is the case this simplifying assumption will not hold and votes received will not be a good proxy for first preference votes.
Keeping these assumptions in mind, how would AV have affected the results of the 2011 election? The first thing to note is that preference votes would only come into play in a minority of the constituencies. In over two-thirds of constituencies (69%) the winning candidate received a majority, and under AV that candidate would win the seat outright (Table 1). Only in the remaining 115 districts (31%) where the winning candidate did not secure a majority would a different winner be possible under AV. Within these 115 districts there is a lot of interesting variation. In some districts the top two candidates fell just short a majority—for example, in Bangkok Constituency #16 where the Pheu Thai and Democrat candidates received 49 and 48 percent of the votes respectively. In other cases, one candidate nearly received a majority but the remaining votes were split between a few contenders. For example, in Chonburi #6 48 percent of voters supported the Palang Chon candidate, while 29 percent voted for the Pheu Thai candidate and 22 percent for the Democrat candidate. Finally, in other constituencies no candidate approached a majority and the vote was split between several parties. For example, in Nakhon Sawan #2 the top four finishers received 28.3, 27.7, 25.1 and 18.3 percent of the vote respectively. In the second example, it us unlikely that AV would have change the outcome, but we can see how different winners could be possible in the first and third examples where the difference between the top two vote-getters is small.
Table 1: Majority v. Non-Majority Constituencies
(Total Constituencies = 375)

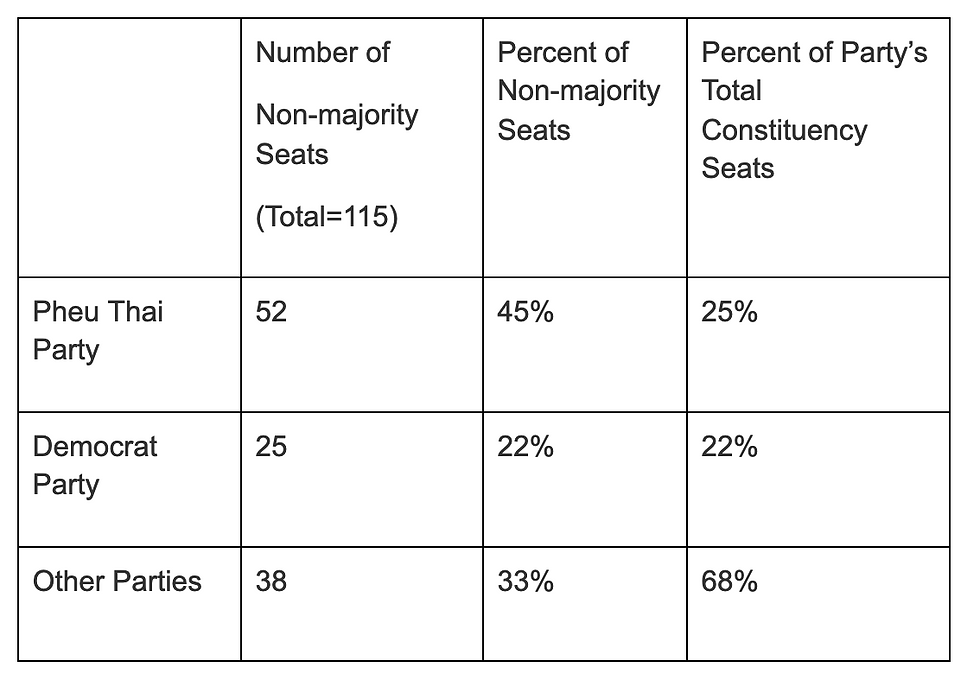
How would the move to AV have affected the fortunes of each party? First, let’s look at how the winners of the 115 non-majority seats were distributed across the parties. As Table 2 makes clear, almost half of those non-majority seats were won by Pheu Thai, 22% where won by the Democrats, and the remainder went to candidates from other parties. Through this lens it is Pheu Thai that faces the greatest risk of a switch to AV. But, if we consider what proportion of the party’s total seats are at risk under AV we can see that minor parties have the most to lose. More than two-thirds (68%) of seats won by minor parties came from non-majority constituencies.
Table 2: Non-Majority Seats by Party
So, which parties would be the big winners and losers under AV? Unfortunately we don’t have information about voters’ second preference, but we can make different assumptions about how those preferences were distributed and then compare the results. In each of the scenarios below I take the votes for all but the top two parties, and redistribute them among the two frontrunners.[1] I’ll consider the following scenarios.
- Strict Scenario: All of the redistributed votes go to the second place candidate.
- 20:80: 20 percent of the redistributed votes go to the first place candidate, and 80 to the second place candidate.
- 30:70: 30 percent of the redistributed votes go to the first place candidate, and 70 to the second place candidate.
- 40:60: 40 percent of the redistributed votes go to the first place candidate, and 60 to the second place candidate.
Let’s start with the strict scenario. What would the results have been under AV if all of the redistributed preference votes were awarded to second place candidates? In other words, what if all of the voters who didn’t give their top rank to the first or second place candidate preferred the second place candidate to the first? Under this scenario the biggest winners are the minor parties that together experience of net gain of 16 seats (Figure 1). Individually, Chart Pattana Pheu Pandin (7 seats), Chart Thai Pattana (6), and Bhumjaithai (5) gain the most. The biggest loser is Pheu Thai, which would lose 16 seats under this scenario. The Democrat Party would break even, gaining as many seats as it loses. How do we interpret these results. Why, for example, does Pheu Thai lose so many seats? In 2011 Pheu Thai candidates were more often the winners in non-majority constituencies than they were the second place finisher, so when we use the strict scenario and give all the seats in non-majority constituencies to the second place candidate, then Pheu Thai (and Phalang Chon) lose more seats than they gain. For most of the minor parties, the situation is reversed—their candidates were more often the second place finisher than the winner in non-majority districts, and so they experience a net gain under this scenario. For the Democrat Party, there were 25 non-majority constituencies in which they had the second place candidate, but there were also 25 non-majority constituencies where they had the first place finisher, so the gains and losses cancel each other out.
If we assume that the party list results remained unchanged, the strict scenario outcome would have been just enough to deny Pheu Thai a majority of parliament, though the balance of power of parliament would otherwise be largely unchanged (Figure 2). (If we don’t consider the party list seats then Pheu Thai would command a slim majority of 188 of 375 seats).
However, the strict scenario is unrealistic. It is highly unlikely that all of the redistributed voters would rank the second place party ahead of the first place party. Figure 3 compares the strict scenario to more plausible assumptions. When the second place party receives either 80 or 70 percent of the redistributed votes we see small net gains for the minor parties (as a group) and for the Democrat Party, while the Pheu Thai party experiences net losses. When the ratio is 40:60, however, Pheu Thai is a net winner and the Democrats and minor parties become net losers.
Finally, Figure 4 shows how the balance of power between the two largest parties would change under the four scenarios. Apart from the implausibly strict case, Pheu Thai maintains control of a parliamentary majority in all of the scenarios.
So, what are we to conclude from this exercise? On its own, AV is unlikely to produce dramatically different electoral outcomes. Most constituencies already produced majority winners in 2011, so introducing AV would have had no direct effect. In those cases where there was no majority winner the net change in the distribution of seats in parliament would not have been large enough to significantly alter the balance of power. Depending on one’s political bent, this could be either a virtue or a vice. But there are other reasons to consider AV apart from any affect it might have on the partisan distribution of powers. First, AV preserves the link between voters and individual candidates/politicians but does so without introducing intra-party competition (assuming that parties are allowed only one candidate per constituency). Second, AV allows more voters to have a say in determining the winner. Let’s not forget that in nearly a third of constituencies a majority of voters preferred someone other than the winning candidate. AV provides an opportunity for those voters to provide more information about their preferences, and ultimately to help decide who wins, and who loses.
[1] In seventy-six percent of the districts all but the top two parties would have to be eliminated in order to produce a majority. In twenty-four percent a majority is mathematically possible short of eliminating all of the remaining parties.


Comments